

Assessing College Football Coaches Using Sports Betting Analytics
To the general public, it is often a mysterious and confounding process: when to hire and fire college football coaches. Looking to a unique measure in sports analytics, however, might provide real insight. Using analytics (with very few exceptions) means using quantities- numbers. Which numbers accurately assess a college football head coach? Looking at win-loss records, Bowl appearances, conference championships, national championships, etc., leaves out context. Context plays a huge role in choosing a reliable measure: Is the coach taking over a losing program, a team that has never made it to a Bowl game, a school in a major conference, a perennial national championship contender, etc.? A coach at Ball State is not expected to win a national championship, but there are still expectations for him and his team. Measuring the degree to which each coach meets those expectations is tantamount to assessing the efficacy of the coach. There is one metric that we think best quantifies the expectations for college football coaches, and it comes directly from the sports-betting world: the margin of victory against the point spread. The point spread is not a prediction of the final score; it is merely the moving target for bookmakers who aim to balance their betting “action.” In other words, the point spread becomes the greatest single measure of how the public perceives each college football matchup. With enough matchups (i.e. games), it becomes THE single best metric to use when assessing expectations for college football coaches.
The point spread is really a quantified psychological position for a matchup. It takes into account every perceived aspect of each team (such as current and historical performance, athletic talent, coaching capability, conference affiliation, injury/suspension issues, etc.), and it places those perceptions into a single representative quantity. Find a head football coach whose team has a positive margin of victory (MOV) against-the-spread (ATS), and you will have found a coach exceeding expectations. Find a head football coach whose team has a negative MOV ATS, and you will have found a coach failing to meet expectations. The graph below shows the average, per-game MOV ATS for six coaches in the four years immediately before their professional lives changed: three otherwise successful, if not legendary coaches right before they were forced out (Bobby Bowden, Bo Pelini, and Mack Brown), and three coaches right before they were promoted to bigger and better places (Kevin Sumlin, Brian Kelly, and Jim Harbaugh):
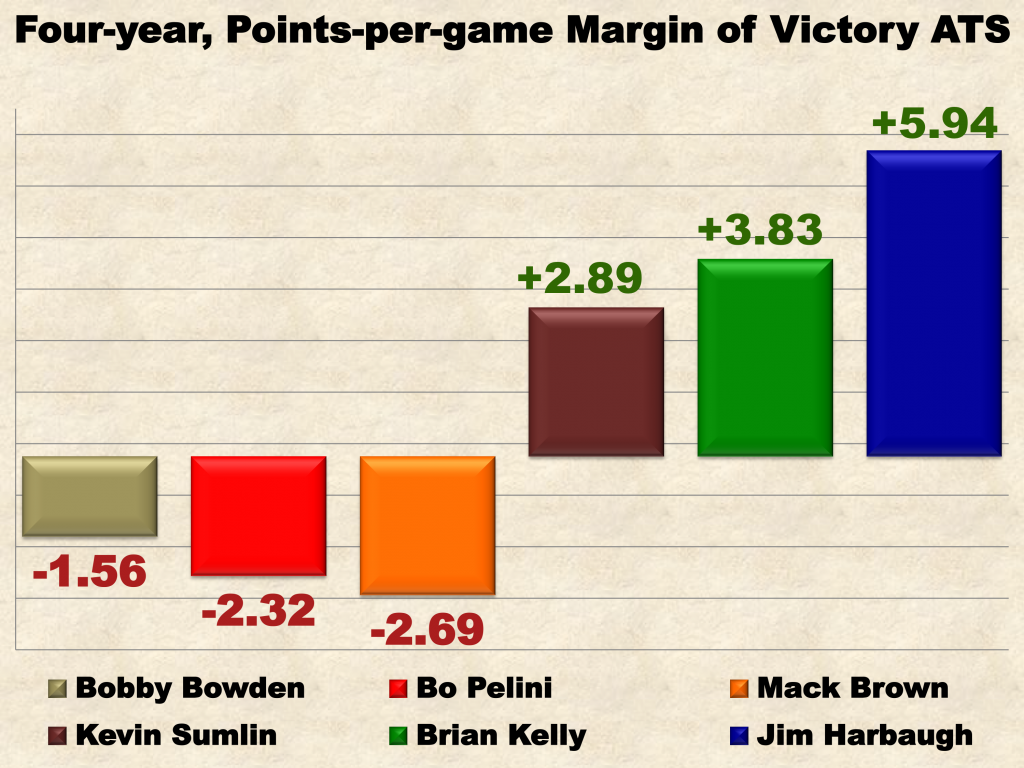
As the chart illustrates, Bobby Bowden at Florida State, Bo Pelini at Nebraska, and Mack Brown at Texas were regularly failing to meet public expectations, as quantified by the margin of victory (or loss) ATS. Coach Bowden won two national championships and took his FSU teams to 28 straight Bowl games. Coach Pelini took his Cornhuskers to Bowl games every season. He was 37-15 straight-up (SU) in the four years before he was fired (including going 9-3 the year he was fired) while winning at least nine games every season he was at Nebraska. Coach Brown competed for two national titles (won one) at Texas, led his Longhorns to victory in 10 out of 15 Bowl games, and only had a solitary (SU) losing season out of 16 at Texas. Despite each coach’s winning record, his Bowl games, conference and national championships (in the cases of Bowden and Brown), their respective schools pushed these coaching icons out the door. The MOV ATS provides the explanation through its numbers.
On the other hand, at Houston, Kevin Sumlin never even won a Conference USA championship. His Cougars were 1-1 in Bowl games (and lower-tier ones, to boot). Still, those statistics do not tell his tale in context. His average, per-game MOV ATS was nearly a field goal before he was hired to take Texas A&M to the next level (into the SEC). Likewise, in the four years leading up to Notre Dame hiring Brian Kelly to lead (arguably) the most storied college football program in history, Coach Kelly never won a major Bowl game, and he certainly did not win or even compete for a national title. What he did do, however, was beat expectations on a consistent basis at both Central Michigan and Cincinnati by nearly four points per game. Jim Harbaugh won just one Bowl game, he never won a conference (much less a national) championship, and his win-loss record at Stanford was 29-21 (58%) when the San Francisco 49ers thought him quite ready to be an NFL head coach. Why? Take a look at that eye-popping +5.94 points-per-game MOV ATS average. The MOV ATS accounts for context and allows for an elegant, objective, numerical assessment for each coach.
CONCLUSION
This country (the United States), outside of Nevada, is still rather skittish when it comes to sports betting- that goes tenfold for the NCAA. All the while, bookmakers in Nevada have become experts at quantifying public expectations for college football matchups, which is to say that bookmakers are excellent at assigning numerical values to college football teams that reflect public sentiment. Since head coaches are judged by their team’s performance, the single greatest metric for assessing how a head college football coach performed, relative to public expectations, is using the margin of victory against-the-spread. Although athletic directors might be apprehensive about using any sports-betting metric for assessing a head coach’s performance, they will not find a better single assessment tool than MOV ATS.
![]()
Warning: count(): Parameter must be an array or an object that implements Countable in /home/colleg63/public_html/wp-includes/class-wp-comment-query.php on line 399